
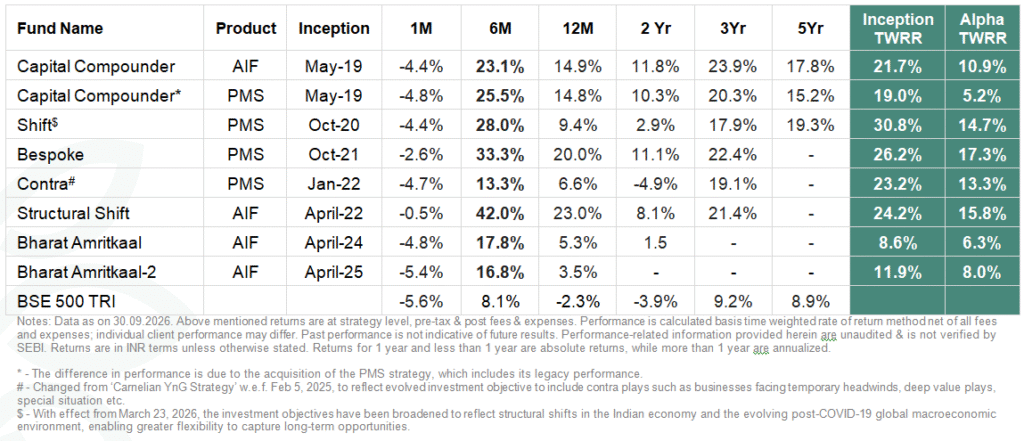
Carnelian strategies performance at a glance…
Greetings from Team Carnelian!
“Big companies have small moves, small companies have big moves.” — Peter Lynch
Small caps have had a remarkable run. Since April 2023, small-cap market value has grown 2.3x, against 1.4x for large caps. After that run, small caps now trade at a higher valuation than large caps.
So many of you have asked us a fair question: is it time to move from small caps to large caps?
Our answer is no. We believe small caps are the most direct way to own the domestic India story, for five reasons.
In May 2023, in our letter Small is beautiful – what makes them big?, we argued that the real risk in small caps is not their size but owning the wrong business. Long-term investors, we wrote, should seek small caps that can become big rather than look for safety in large caps. Three years on, the evidence has only strengthened that view and the shift we were early to identify is now visible in the data.
For this letter, we studied 1,594 listed companies, each worth more than ₹1,000 crore, with financials going back to FY2000. The evidence points to a clear conclusion: small and mid-caps are the most direct way to own domestic India, and their earnings engine is broader and faster than that of large caps. Let’s look deeper.
Where the profits really come from:
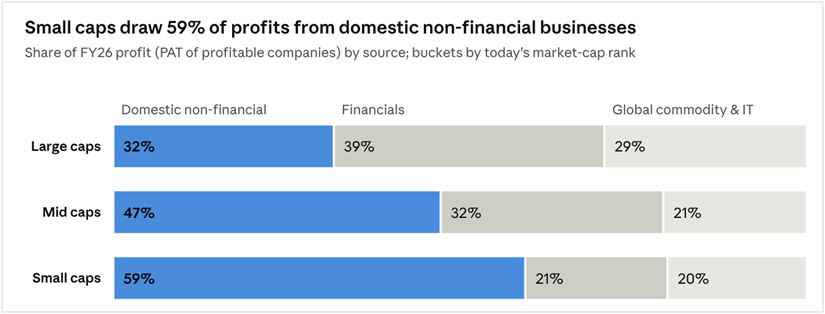
The split we described at the start is the most important exhibit in this letter. Small caps are the purest way to own India’s domestic economy.
Source: Carnelian analysis of Bloomberg data, 1,594 companies, FY26
Large-cap profits lean on banks and on businesses priced off global oil, metals and IT spending. Domestic non- financial contributes 32% of large cap profit pool vs 59% of small cap.
The sector mix tells the same story. By market value, small and mid-caps hold more healthcare (12% vs 5% for large caps), industrials (17% vs 13%), consumer discretionary (15% vs 11%) and materials (14% vs 9%). Financials, energy, IT and utilities make up 51% of large caps, but only 30% of small and mid-caps.
This matters because the two halves of the economy have moved differently. Over FY23–26, large caps’ global businesses grew revenue just 1.8% a year, while their domestic businesses grew 12.4%.
Faster earnings growth — and accelerating
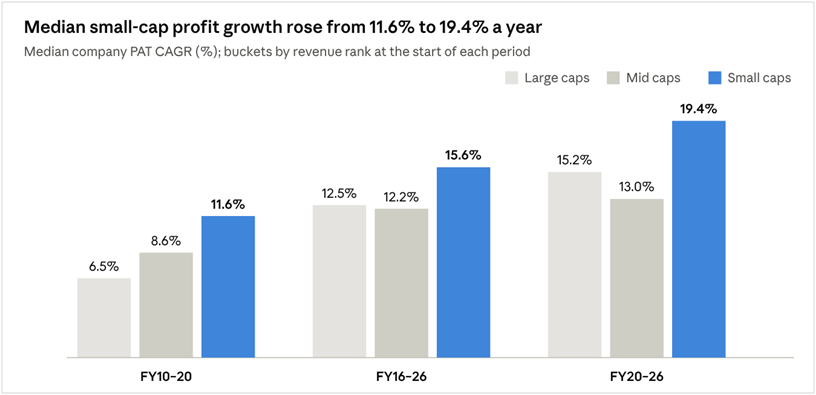
The median small cap has consistently outgrown its larger peers. Over FY16–26, median small-cap profits grew 15.6% a year, ahead of 12.5% for large caps and 12.2% for mid-caps with the gap widening in recent years.
Carnelian analysis of Bloomberg data; median of companies profitable at both ends of each period
Revenue tells the same story: Over the same period, the median small cap revenue grew 12.0% a year, ahead of 9.4% for large caps and 8.4% for mid-caps.
The advantage is not simply a result of sector mix. Even if small caps had the same sector composition as large caps, their profit growth would still have been higher at 18.2%, against 15.2% for large caps. Small caps also outgrew larger peers across key sectors including industrials, healthcare and IT.
The gap was widest in FY20–22, as smaller companies gained share and repaired their balance sheets. Since FY22, their edge has increasingly come from breadth: a much larger number of small companies are compounding earnings at high rates.
A much deeper pool of compounders:
Small caps offer a much deeper pool of fast-growing businesses. Over FY16–26, 279 small caps compounded profits above 20% a year, against just 13 large caps.
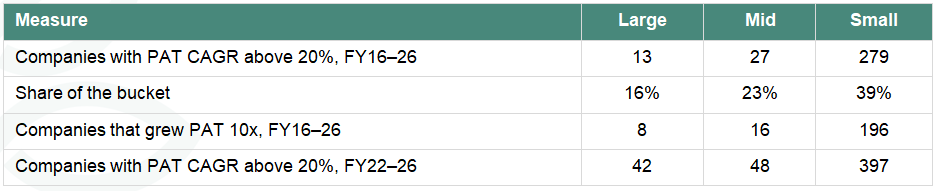
Even over FY22–26, when the median small cap grew about as fast as the median large cap, 397 small caps compounded profits above 20% a year. For an active investor, the size of this pool matters more than the average.
Stock selection pays more in small caps
The best small caps beat the best large caps by a wide margin, while the weakest look much the same. Over FY16–26, top-quartile small caps grew profits 27% a year, against 18% for top-quartile large caps.
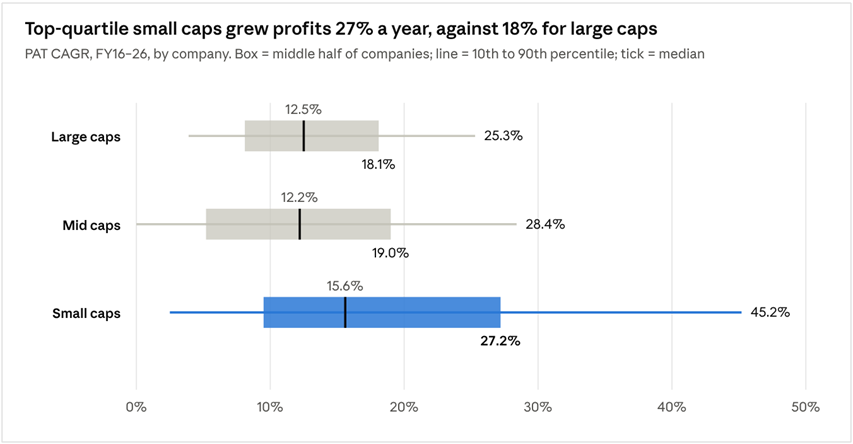
Carnelian analysis of Bloomberg data; companies profitable in FY16-26
Market outcomes are just as spread out. Since April 2023, 354 small caps have more than tripled in value, while 171 have lost money. The gap between the top and bottom deciles of small caps was 820 percentage points, nearly five times wider than for large caps.
In small caps, stock selection matters far more than simply owning the segment.
Small caps re-rated, large caps de-rated
A stock’s price is simply earnings × multiple.
Since April 2023, the market has paid more for each rupee of small-cap profit and less for large-cap profit. The small-cap P/E rose from 18.8x to 32.5x, while the large-cap stayed at 21x P/E.

Large caps grew earnings well, but de-rating meant investors kept only part of that growth. Small-cap returns came more from re-rating. The honest implication is that small caps no longer look cheap on trailing earnings, so today’s case must rest on the growth ahead.
Valuation has to be seen alongside earnings growth. Let’s take the example of Laurus Labs.
In FY24, the stock looked expensive at current P/E of 78x. But earnings grew nearly 3x over the next two years, while the stock increased 4x over the same period. The lesson is that a high P/E can look very different when earnings are compounding rapidly. If small caps are growing materially faster than large caps, they will naturally look expensive on current earnings — but the more relevant question is what you are paying for the earnings they can generate in the future. Does forward growth justify the premium?
Consensus expects the median small cap to grow profits 26.6% a year over FY26–28, against 18.7% for large caps. At that pace, the small-cap premium largely disappears by FY28.

On FY28 estimates, small caps trade roughly in line with mid-caps and close to large caps, while growing faster than both. The domestic tailwinds now in place, including the GST rate cuts of September 2025 and lower interest rates, fall mostly on the domestic businesses that dominate small-cap profits.
Compare like with like:
The headline large-cap P/E hides two very different markets. About 60% of large-cap FY27E profit comes from financials, global commodities and IT, which trade at just 13–19x — ONGC at 5x, Coal India at 8x, LIC at 8.5x, Infosys and TCS at about 13x, Reliance at 18x. These few, very large and cheap profit pools pull the large-cap average down.
The typical large cap looks nothing like that. Of the 84 large caps with estimates, 46 are domestic, non-financial franchises, and they trade at a median of 42x FY27E. 44 of the 84 trades above 30x, and 21 above 50x. In other words, investors are already paying a steep premium for domestic growth — they are simply paying it in large caps.
So, the fair comparison is within India’s domestic, non-financial economy, leaving out financials, commodities and IT. There, small caps are both cheaper and faster growing.
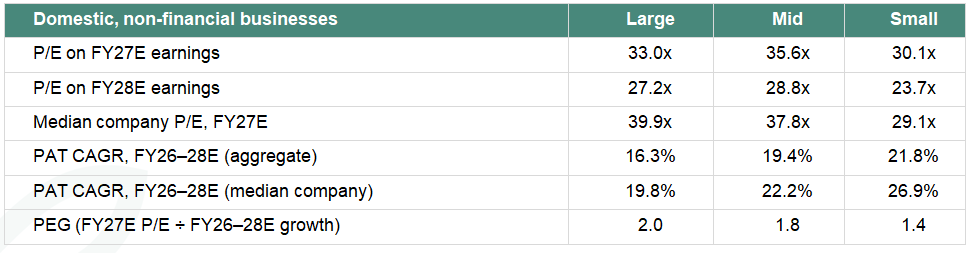
For the same domestic growth story, small caps offer faster growth at a lower price. An investor who moves to large caps for valuation comfort is, in practice, buying either cheap global cyclicals or domestic franchises priced at 40x.
What could go wrong?
These risks are real. But as we wrote in 2023, the real risk is not the company’s size; it owns a bad business with weak management. That makes selection and patience essential.
How we approach it
The spread of outcomes in small caps is both the opportunity and the risk. Our framework, first set out in Small is beautiful, looks for five things: a large and growing opportunity, a real moat, promoters with a scalability mindset and the ability to execute, efficient capital allocation, and strong governance. Our Magic and CLEAR framework equips us to identify the winners in the small cap space.
The common narrative for the past decade has been that large caps are safe, while small caps are risky. Through this letter, we aim to put this narrative into right perspective. India is transforming rapidly, creating a growing number of opportunities beyond the large-cap universe, with many of these businesses growing faster than their larger peers.
That’s the reason our AMC business is making a bold move to begin its long journey with the launch of the Carnelian Small Cap Mutual Fund. Please look out for more details on the launch soon.
Thank you, as always, for walking this journey with us. Your support and trust mean a lot to us.
About the data