Greetings from Team Carnelian!
“Diversification is protection against ignorance. It makes little sense if you know what you are doing.” — Warren Buffett
We’ve been getting this question a lot lately from our clients. In almost every investor meeting or interaction over the last few months, someone leans in and asks some version of the above question. Obviously, most clients are seeing lots of products being offered.
Why this question, why now?
Look at the table below. The 1-year column tells the entire story of why this question is suddenly everywhere:
Exhibit 1: MSCI Index Returns, USD terms (data as of latest period)
| Index | 1 Year | 5 Year | 10 Year | 20 Year |
| MSCI India | 3.0% | 13.0% | 13.3% | 10.7% |
| MSCI USA | 28.5% | 12.9% | 15.3% | 11.0% |
| MSCI Korea | 207.5% | 20.5% | 18.1% | 10.9% |
| MSCI Taiwan | 117.8% | 25.9% | 24.3% | 13.4% |
| MSCI China | 11.4% | -4.0% | 6.1% | 6.3% |
| MSCI ACWI | 29.5% | 11.4% | 13.1% | 8.6% |
| MSCI EM | 44.9% | 6.7% | 10.1% | 6.0% |
Note: MSCI ACWI – All Country World Index — 47 developed and emerging markets, ~85% global market cap. MSCI EM: Emerging Markets Index — 24 EM countries, ~85% of EM free-float cap.
Korea up 207%. Taiwan up 117%. EM up 45%. China up 11%. ACWI up 30%. India up only 3%. If you’re an Indian investor watching this from the sidelines, the temptation to “do something” is enormous.
It is very human to feel left out when your portfolio isn’t moving while others are, especially your friends. This feeling pushes market participants to create products and craft narratives that appeal to current investor psychology (more on this later). There’s no fault of the participants — they are simply supplying what sells at that time. But does that mean it’s the right thing to do? Let’s see.
Let’s look at the other columns. Over 10 years, MSCI India has compounded at ~13% — ahead of EM (~10% despite the recent 12 months), ahead of ACWI on a risk-adjusted basis, and at the very top of the EM pack on consistency (Korea and Taiwan look comparable due to recent returns). Over 20 years, India is the most consistent performer in the table at ~10.7%, with no massive underperformance over 5-year like China and no boom-bust pattern like Taiwan or Korea.
In other words: the longer the lookback, the better India looks. The shorter the lookback, the worse it looks. That single observation is the most important thing on the page — and we’ll come back to it.
First, what does diversification really mean?
My friend Rishabh Mariwala puts it really well:
Diversification in a family office is often misunderstood. It is easy to assume that spreading capital across more assets automatically reduces risk. In reality, diversification only works when it is built on clarity.
Many family offices begin with a concentrated exposure to the operating business that created the wealth. As liquidity increases, investments start to move into public markets, private deals, real estate, and alternative opportunities. On the surface, that can look like progress. But without a unifying framework, diversification can quickly become fragmented.
Different investments get made for different reasons. Some are driven by familiarity. Others by access. A few by conviction. Over time, the portfolio starts to reflect activity rather than strategy.
The real value of diversification lies elsewhere.
Diversification comes from understanding correlation, liquidity, time horizon, and the role each allocation plays within the broader pool of capital. That requires a more disciplined way of thinking.
A family office does not benefit from owning many things. It benefits from knowing why each position exists and how the portfolio behaves as a whole. That is where evolution begins. Diversification is not about collecting exposure. It is about building balance with purpose.
Notice what it does not say. It does not say “spread across as many geographies as possible.” It does not say “if one market is down and another is up, switch.” It says four things: correlation, liquidity, time horizon, role. Tested against this lens, the case for moving 20-30% offshore today gets much weaker.
1. Correlation — is “global” really diversified?
The MSCI ACWI (the world index) has the US at over 60% (up from ~50% a decade ago) — so “global diversification” in 2026 is, in practice, mostly a US allocation, dominated by 7-10 mega-cap tech names contributing over a third of the S&P 500. But the bigger issue: if the goal is lower correlation to your existing Indian equity portfolio, US equities are not the best answer:
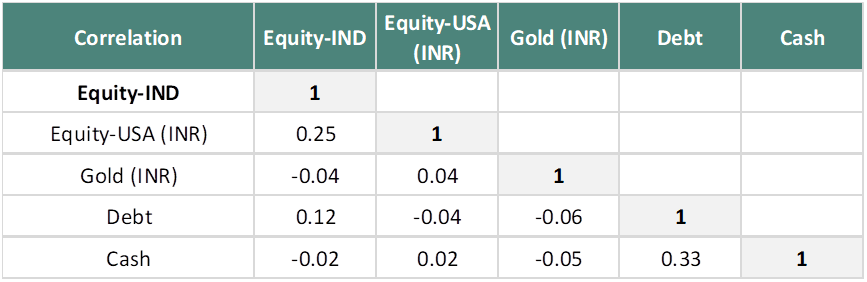
Source: MOPW Alpha Strategist April 2026
As seen above, Gold, Indian debt, and real estate are all better diversifiers than US equities for an Indian portfolio — and US equities’ correlation tends to spike during exactly the moments you most need diversification to work (2008, 2020).
2. Liquidity — the silent cost of going global
For an Indian investor, offshore liquidity has multiple layers: the security itself, the vehicle (feeder funds often have monthly/quarterly windows), and the regulatory layer.
Take tax alone. Indian equity gains turn long-term in 12 months at 12.5%. Foreign equities take 24 months — double the wait — and short-term gains are taxed at your marginal slab (30%+ for most HNIs) instead of 20% for Indian equity. That’s before LRS limits, TCS, FEMA reporting, repatriation friction/costs, and complex tax filings.
3. Time horizon — what the next 25 years actually look like
This is where the current pitch is most flawed. It’s built on a 1-2 year lookback. But your money has a 10, 20, 30 year horizon. The right question isn’t which market delivered the last 12 months — it’s which is positioned to deliver the next 25 years.
Goldman Sachs Global Investment Research, in “The Path to 2075 — Capital Market Size and Opportunity”, projects:
- US share of global equity market cap declines from 42% (2022) → 27% (2050) → 22% by 2075.
- India records the largest increase of any country — from ~3% (2022) to 8% (2050) to 12% (2075).
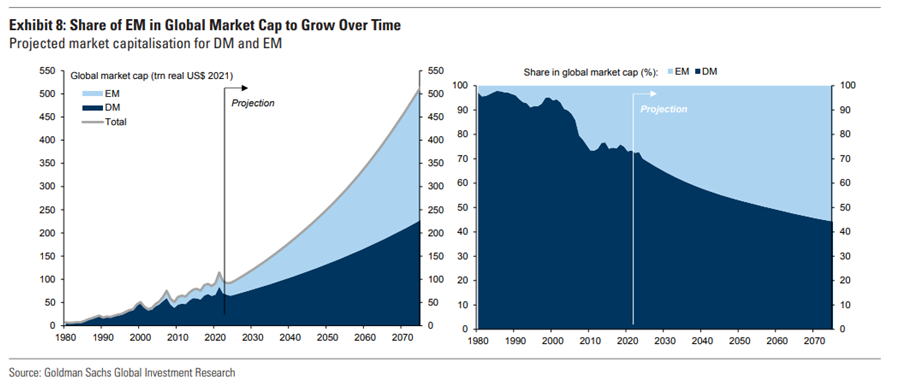
In other words: India’s share of global market cap roughly quadruples while the US share roughly halves. The advice to “reduce India, add US” is, on a 25-year horizon, exactly backwards.
“What about medium term? Will India underperform for another 2-3 years while the US keeps running?” Probably not. India’s earnings downgrade cycle appears to have bottomed — the early Q4FY26 results are showing accelerating growth, while US earnings are decelerating from peak rates.
Even on a short-term view (6-12 months), the asymmetry favours India. The de-rating in Indian valuations and the flow shift to US/Taiwan/Korea have largely played out – and the valuation point below reinforces this.
The US Buffett Indicator (mcap-to-GDP) is at ~225-230% — the highest in recorded history, over 2 standard deviations above trend. The dot-com peak was ~140%. The 2007 peak was ~110%. India’s ratio sits at ~120% – below its 2007 peak and modestly above its long-term average of ~85%.
So, an Indian investor “diversifying” today is, in effect, selling a market at ~120% mcap-to-GDP to buy one at ~230% mcap-to-GDP. That isn’t role-based diversification. That’s buying high to feel safe (investors did that with Japan in 1980s and see how that turned out).
4. Role — what is each allocation actually doing?
Every rupee should have a role: compounder, income, inflation hedge, currency hedge, optionality. When you add an allocation, the question is not “is this asset good?” — it is “what role is it playing, and is that role unfilled in my portfolio?”
Here’s the asymmetry wealth managers rarely articulate: the same allocation decision looks completely different depending on whether you’re an Indian investor or a global one.
For a global investor, Indian equities fill a role nothing else can — access to the fastest-growing major economy, the best demographic dividend on the planet, and the destination of the next 50 years of market cap growth and reallocation (Goldman: ~3% → ~12% by 2075). That’s why every major global house is publishing standalone India research and increasing India weight.
For an Indian investor, the calculus runs in reverse. The compounder role is already filled — and filled well — by Indian equities at home. So, the honest question becomes: what role does global allocation play that India does not? Three real answers exist (currency hedge for specific USD liabilities, exposure to industries genuinely absent in India, and the higher-return engine being marketed) — and only the first two justify allocation, sized to individual needs.
And what about Korea, Taiwan, China?
Korea & Taiwan are essentially semiconductor and electronics derivative plays — Samsung, SK Hynix, TSMC drive disproportionate weights. Single product cycle, single end-market direction (AI capex), significant geopolitical risk vs China, and demographics among the oldest in Asia. The 5-year and 10-year MSCI Taiwan numbers are stunning — but they reflect a single, mature chip-cycle bet, not broad-based growth.
China deserves more nuance. Property hangover, multi-quarter deflation, demographic decline, capital controls, and an environment where the state can wipe out entire sectors overnight (edtech 2021, tech 2022). Despite a high GDP growth rate over 20 years, the MSCI China index has compounded at ~6% in dollar terms — versus MSCI India at ~11%. Look at the 5-year column: MSCI China is at -4% CAGR. GDP growth alone doesn’t translate to investor returns. Governance, capital allocation, and rule of law do.
India should not be put in the same bucket as these markets:
| Factor | India | China / Korea / Taiwan |
| Economic breadth | Broad-based — financials, IT, consumption, manufacturing, pharma, infra | Narrow — heavy in tech/electronics or property/state-owned |
| Demographics | Median age ~28; favorable for next 25-30 years | Aging rapidly; declining workforce |
| Governance | SEBI-regulated, independent judiciary, free press | State-influenced (CN); concentration risk (KR/TW) |
| Growth driver | Domestic consumption, capex, formalization along with exports | Largely export-led |
| Domestic flows | 150mn+ demat accounts, Rs 25,000+ cr monthly SIPs | Limited domestic depth |
The historical analogy
India today sits roughly where Japan was in the 1960s — a decade before its miracle decades, with manufacturing stepping up, savings rates rising, and a demographic dividend kicking in. Or where the US sat in the early 1900s — transitioning from a regional emerging market into the dominant force in global capital. In both cases, investors who diversified away during a flat patch missed multi-decade compounding cycles.
India just became the world’s 4th largest economy (for a brief time). India’s 3% → 12% share in global market cap is the modern, quantified version of that same story. The runway is just beginning.
Worth noting: the many funds that have rotated into China and Emerging Markets pre- and post-Covid on the basis of “cheap valuation” have largely underperformed.
So why is this advice everywhere right now? The biases at play.
Now go back and look at Exhibit 1. The 1-year column is the most psychologically powerful column on the page — and the least useful for decision-making. That’s the trap. Investor biases:
- Recency bias: Twelve months of underperformance feels eternal; a decade of outperformance gets forgotten. Exhibit 1 shows India’s 10-year (~13%) and 20-year (~11%) numbers are the most consistent in the table. But the ~3% in the 1-year column is what triggers the panic call to the wealth manager.
- Grass-is-greener bias: We see every bump in our own backyard. Foreign markets look smoother because we don’t see their bumps from this distance.
- FOMO: Watching dollar returns being talked about at every dinner party is psychologically exhausting.
So, when does global allocation actually make sense?
Going back to the four-factor lens:
- When correlation is genuinely low — industries truly absent in India. Real diversification, but small (5-10%).
- When liquidity matches a real liability — USD-denominated future expenses, e.g. child’s education overseas, medical bills, etc. Asset-liability matching, not return chasing.
- When the time horizon is short — USD needs in under 5 years.
- When the role is currently unfilled — small tail-risk hedge or specific currency hedge.
What is not a good reason: “India was flat last year and the US was up.” That’s performance chasing dressed up in diversification language.
Our view & guidance
India offers the rarest combination available in the world today: high growth, improving capital efficiency, consistency, demographic longevity, and structurally improving governance — at a valuation that is reasonable by any historical standard.
The setup is rare, and it is specifically Indian: superior fundamentals + the fastest earnings growth among large economies + rising incremental flows = the conditions for a structural re-rating. Goldman’s 50-year projection captures the destination. Our job, and yours, is to stay invested throughout the journey.
When global investors remain structurally underweight India (active managers are running 2-3% below benchmark) and domestic investors are being urged to reduce India to chase recent winners abroad — that, historically, has been a moment to lean into India, not away from it. Real diversification — the kind built on correlation, liquidity, time horizon, and role — would tell most Indian investors today to do less, not more. To trust the structural story, not the 12-month chart.
So, our message is simple. This is not a moment to reduce India exposure. It is a moment to recognize that India’s structural re-rating is in front of us, not behind us. The right portfolio response is to hold India as the core — complemented, where genuinely needed, by global allocation that captures themes the domestic market cannot offer.
A word on the obvious near-term concern. Yes, the current geopolitical situation has softened India’s near-term macro — pressure on the rupee, FX reserves, and import bill is real. But these are event-driven pressures, not structural impairments — and the 25-year thesis does not move on short-term geopolitical noise.
Warren Buffett has built one of the great fortunes of all time on a single conviction: Never bet against America. Sitting where India sits today — one of the world’s largest and fastest-growing economies, with its best demographic, institutional, and capital-market decade still ahead — we’d suggest the Indian investor consider adopting the same rule, with one word changed. Never bet against India. Avoid distraction.